If you have a house, you have a roof and you can install solar panels. But if your ambition, like Amsterdam, is to push the transition towards renewable energy by having a million solar panels installed, it becomes a large-scale urban planning puzzle. One that not only involves rooftops and lines of sight, but also the underground electrical grid and even the drainage of rainwater.
Before Maarten Verkou got involved in helping the city of Amsterdam achieve its green ambitions, he researched the optimal use of solar panels at a much smaller scale. While still pursuing his master’s degree in Sustainable Energy Technology, he met Hesan Ziar, assistant professor in the Photovoltaic Materials and Devices group and specialized in the development and use of photovoltaic systems technology. ‘Ziar supervised me for my MSc thesis project, in which I investigated the feasibility of an indoor solar lamp,’ Verkou says. ‘The lamp was only allowed to harvest energy from indirect, diffuse, sunlight. No one really knew what was possible.’ The project involved three-dimensional modelling of two typical Dutch rooms – his own living room and office – as well as detailed simulations and calculations. ‘Having a bachelor’s degree in mechanical engineering, I was especially delighted by the prospect of building a prototype lamp.’
Excess rainwater
Immediately following his thesis defence, Verkou received an offer to become a project researcher in the same group, on a one-year project related to the large-scale use of solar panels in an urban setting. ‘By the year 2022, the city of Amsterdam wants to produce an amount of solar energy equivalent to the installation of about a million solar panels,’ Verkou says. ‘They want to know where to focus the city’s efforts in promoting, or even subsidizing, the installation of these panels. Which neighbourhoods, streets or even houses will have the highest yield? Does the low-voltage electrical grid put a limit on the use of solar panels? And what about the competing interest of increasing the number of so-called green and blue roofs for improving the overall air quality and for processing excess rainwater.’ These and other questions are all part of the project carried out at the Amsterdam Institute for Advanced Metropolitan Solutions (AMS Institute). It was Associate Professor Olindo Isabella –principal investigator at the AMS Institute, head of the Photovoltaic Materials and Devices group at TU Delft, and initiator of this project – who knew just who to approach for the extensive 3D modelling, simulations and calculations that would be required. ‘The main goal of the project is to provide the municipality of Amsterdam with a roadmap, in the shape of an advent calendar, indicating when to prioritize which neighbourhood regarding the installation of solar panels,’ Verkou says.
Ideally suited to be put a roof
You may wonder if it isn’t much easier to cover some patches of grassland with solar panels, rather than install them in the city. ‘It would correspond with the current use of the electrical grid, production at a central location followed by one-way distribution,’ Verkou explains. ‘But that simply isn’t the vision for the future of cities. Rather than transporting more and more electricity towards cities, in order to meet their increasing energy demand, it makes more sense for cities to evolve into production and use on location – self-sustaining neighbourhoods that produce as much energy as they use. Besides, solar panels are lightweight and flat and therefore ideally suited to be put on a roof.’
From skyline to solar yield
‘The first step in our calculations is to determine the maximum possible yield, in solar energy, for each of the houses in a region,’ Verkou says. ‘We determine all locations where the payback period of a solar panel is ten years or less. For this we use the Actueel Hoogtebestand Nederland, which provides detailed elevation information for all of the Netherlands. Using these data, we have a three-dimensional map allowing us to, virtually, put solar panels on roofs as well as walls and to optimize their orientation towards the sun for maximum yield.’ Standard techniques require the calculation of the solar yield for each of the 8760 hours in a full year (365 days of 24 hours each), taking into account the shadowing effect of high-rise buildings and even trees for each possible orientation of the panel. ‘It is a feasible method for a single building but too time consuming when applied to an entire neighbourhood, let alone a city,’ Verkou explains. ‘Luckily, my supervisors have recently published a method for quickly calculating the annual solar energy potential in urban environments.’ Their method summarises the entire skyline, as “viewed” by the solar panel in all possible directions, into two parameters only – a parameter to estimate the year-round irradiation from indirect, diffuse sunlight, and a parameter for the irradiation from direct sunlight. ‘It only takes minutes to perform the required calculations for a thousand buildings,’ Verkou says.
An intricate spiderweb
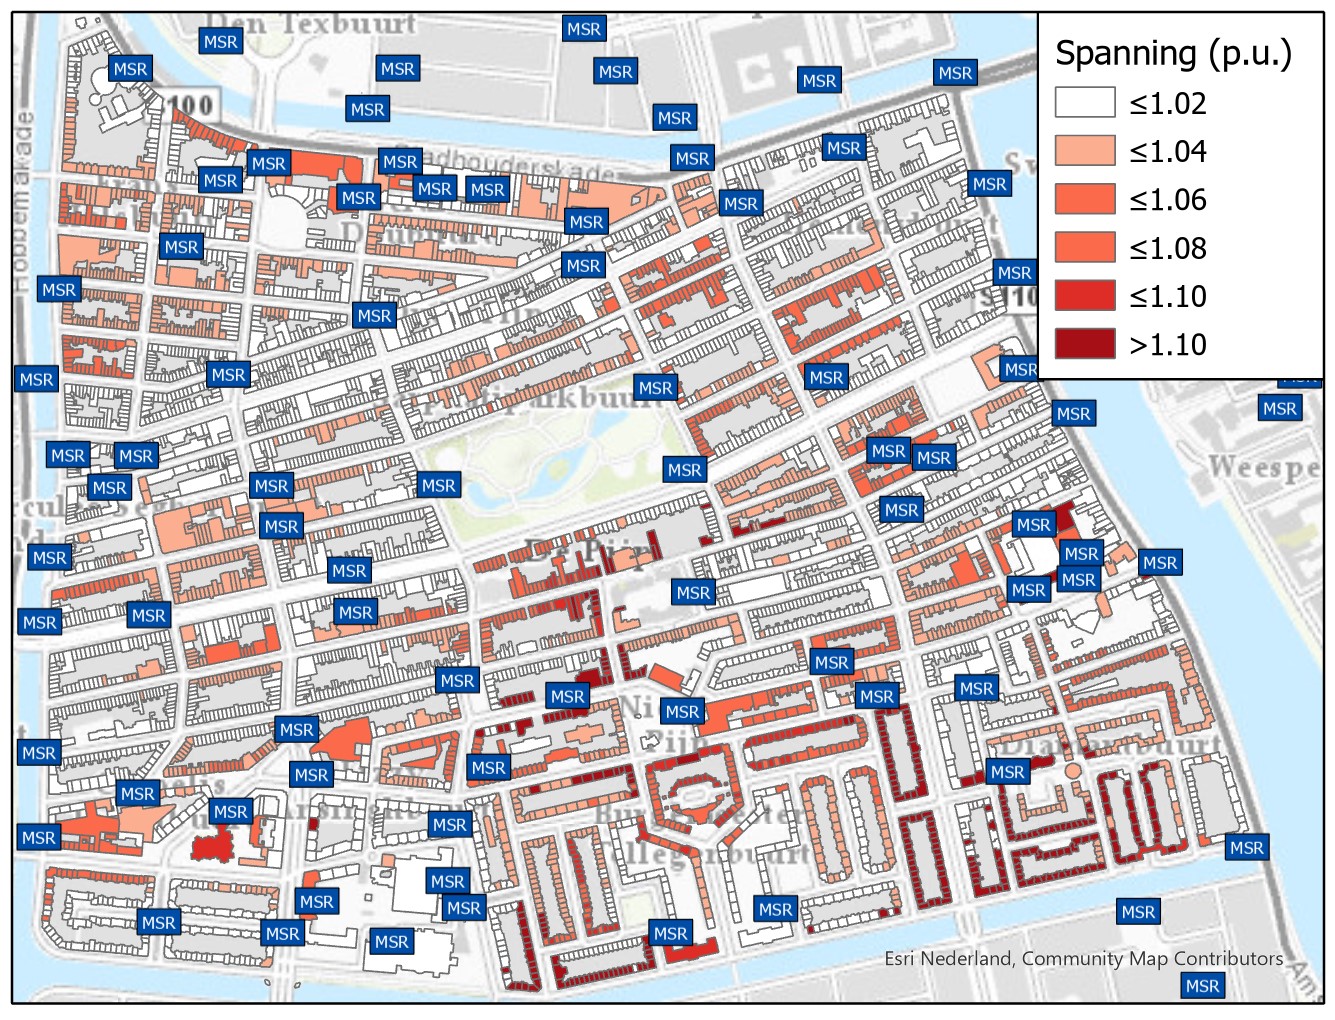
Calculating the maximum solar yield was rather straightforward for Verkou, given his background in solar panels and the already existing mathematical model. But determining possible bottlenecks in the underground low-voltage electrical grid was an entirely new exercise for him. ‘This grid is quite old and has originally been designed for the one-way distribution of electricity,’ he says. ‘If the sun appears from behind the clouds and thousands of solar panels suddenly start pushing excess energy towards the neighbourhood’s transformer station, it may be overloaded to the point of failure.’ It is because of such peak variations that certain neighbourhoods or streets may be allowed to only produce a fraction of their maximum solar yield. ‘In Amsterdam, the low-voltage network has a mesh-like structure, somewhat like a spiderweb,’ Verkou continues. ‘This is an ideal layout for the future situation of distributed production and localized use of electricity. It does, however, complicate the calculations towards possible grid failures.’
Many layers of city information
‘The real value and uniqueness of the project is that we combine many different layers of city information,’ says Ziar, who again serves as Verkou’s day-to-day supervisor. In urban planning, after all, one always has to weigh competing interests. The municipality of Amsterdam provides the location of historical buildings in order to exclude these from the calculations. Yet another data layer indicates which roofs are or may need to be designated green or blue, in order to help protect Amsterdam from the consequences of torrential rainfall. The low-voltage grid operator provides data on solar panels already installed and the researchers themselves construct a data layer from permit requests granted and under consideration for adding a roof deck. ‘What we are creating is a complete solution for determining the limit of large-scale utilisation of solar panels in urban areas,’ Ziar says.
Real and virtual reality
In the eleven months that he has worked on the project Verkou has developed a keen eye for the urban use of solar panels. ‘That’s how you do it,’ is what he thinks when travelling past a German village packed with solar panels. He also took a bike ride through de Pijp, the Amsterdam neighbourhood they are modelling first. ‘It was quite thrilling to see the neighbourhood in real-life and the potential it has for installing solar panels,’ he says. Visualizing the optimal placement and impact of a million solar panels in the city, however, requires something more than a bike ride. ‘That is why our tool will include a virtual-reality environment. Civil servants can use it to get a comprehensive overview of their city as to its solar power potential. It will also indicate the need for green and blue roofs and potential issues with the low-voltage electrical grid, probably using colour coding.’ The tool will also be important in enthusing citizens, showing them how limited the visual impact may be of adding solar panels to their building, or their neighbour’s.
Way beyond Amsterdam city limits
‘Once completed, our tool can easily be applied to Rotterdam or any other city,’ Verkou says. ‘The elevation data is publicly available. All that is needed is to import the layout of the low-voltage power grid and the other data layers, which we will make as user-friendly as possible. Then, it only takes a single push of a button.’ Although initially designed for cities, the tool can also be applied to large open areas such as Schiphol, or even to covering patches of grassland with solar panels. ‘It will probably evolve into a TU Delft spin-off,’ Verkou says, ‘a start-up company pushing the energy transition all over the Netherlands.’
Text: Merel Engelsman | Photography: Frank Auperlé
A three-dimensional impression of the full potential of solar panels in de Pijp in Amsterdam, showing all locations where the payback period of a solar panel is ten years or less.
On the day with the highest sun intensity, some neighbourhoods may produce too much solar energy. This leads to voltage differences (dark red, more than 10% voltage difference) that can destabilize the (local) electrical grid, requiring intervention by the grid operator to prevent a possible domino effect.

